The U.S. Treasury market is entering a significant transition period in 2025, facing both structural adjustments and all-too-familiar policy discussions. As the Federal Reserve’s (Fed) shift from a zero interest-rate policy (ZIRP) coincides with a substantial $7.5 trillion refinancing cycle, markets are also preparing for another round of debt ceiling negotiations. For investors, this environment presents compelling opportunities in Treasury securities: Yields above 4% across much of the Treasury curve offer attractive risk-free returns (although market volatility is expected to remain elevated), with potential for capital appreciation if yields fall. However, careful security selection is warranted — investors might consider avoiding Treasury Bills (T-bills) maturing around potential debt ceiling deadlines while taking advantage of higher yields in longer-dated securities that extend beyond these near-term political discussions (we think the sweet spot is in the 1–5-year parts of the Treasury curve). While each of these challenges is manageable, their combination requires thoughtful navigation from policymakers and careful consideration from market participants.
An Ever-Growing Debt Load?
While this isn’t new to anyone that has turned on the evening news lately, America has a debt problem, especially of late. The U.S. federal debt load has followed an increasingly steep trajectory over the past few decades, but the post-COVID-19 era marks an unprecedented acceleration. While debt grew steadily from around $5 trillion in 1996 to approximately $20 trillion by 2020, the pandemic triggered an extraordinary surge, pushing the total to more than $36 trillion.
The COVID-19 pandemic necessitated massive government spending through various emergency measures, including stimulus checks, enhanced unemployment benefits, business support programs, and healthcare expenditures. The Coronavirus Aid, Relief, and Economic Security (CARES) Act and subsequent relief packages, while crucial for preventing economic collapse, added trillions to the federal debt in a matter of months. This emergency spending, combined with decreased tax revenue due to reduced economic activity during lockdowns, created a perfect storm for debt accumulation.
What’s particularly concerning is that even after the immediate crisis passed, the debt has continued to grow rapidly. This suggests structural issues in federal spending and revenue collection that extend beyond emergency pandemic measures. The post-COVID-19 era has brought new challenges, including inflation pressures, rising interest rates, and increased costs of servicing the growing debt load.
The implication of this debt trajectory is significant, with higher interest rates ultimately increasing the cost of servicing this debt, which is becoming increasingly substantial. As the Fed raised rates to combat inflation, the government’s interest payments have grown significantly, creating a concerning feedback loop where debt service requires more borrowing. According to the Congressional Budget Office (CBO), net interest payments are set to make up nearly a quarter of all federal outlays by 2054, rising from 13% currently, while total debt loads are headed to over 160% of gross domestic product (GDP) over the same period.
Looking forward, the trajectory of the U.S. debt load suggests that without significant policy changes the debt will continue to grow. The steepening of the curve indicates an accelerating pace of debt accumulation, which could become increasingly difficult to manage.
Increasing at an Accelerating Rate
U.S. Treasury Debt Has Exploded Higher Recently
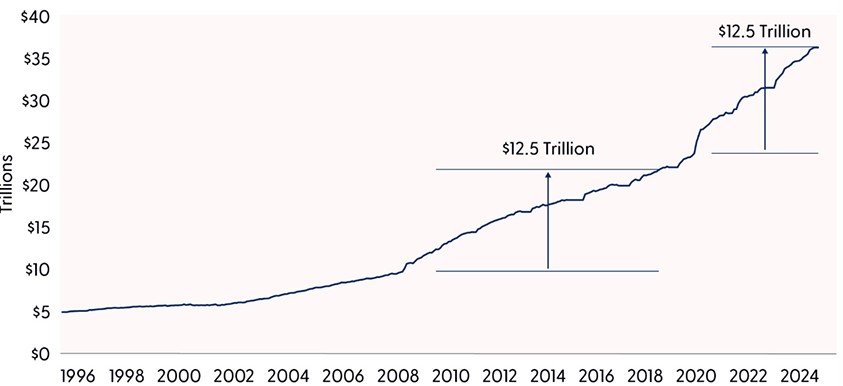
Source: LPL Research, Bloomberg, 02/19/25
The Looming Treasury Maturity Wall: A $7.5 Trillion Problem
The Treasury market is entering a significant transition phase as it adapts to higher interest rates. Over the next three years, approximately $7.5 trillion in existing coupon debt needs to be refinanced, marking one of the largest refinancing cycles in U.S. history. With the weighted average coupon rate on existing debt around 2.75%, and current market rates between 4% and 4.5%, this shift represents a substantial change in government financing costs. The expected increase in interest payments of between $94 and $131.5 billion annually reflects the broader normalization of interest rates following the ZIRP era. And, while current yields reflect general concerns about Treasury supply, we may not have seen the full impact of this refinancing cycle on the curve, especially if the Treasury Department decides to extend the maturity profile of its debt (although just last week, Treasury Secretary Scott Bessent said those actions are a “long way off”).
The size of the maturity wall, combined with the rate differential between maturing and new debt, represents a structural shift in government financing costs. The implications for portfolio strategy, market structure, and monetary policy will likely dominate fixed income markets for the next several years.
For investors, this environment creates interesting opportunities. While higher borrowing costs aren’t great for the U.S. government, Treasury yields at levels not seen in over a decade offer attractive risk-free returns (although volatility is expected to stay elevated), particularly in short to intermediate-term securities. Additionally, with yields well above recent averages, Treasuries are regaining their traditional role as a meaningful source of portfolio income.
Moreover, higher Treasury rates extend throughout financial markets, influencing everything from mortgage rates to corporate borrowing costs. This suggests investors should consider their fixed income allocations holistically — while higher Treasury yields are attractive, they also create opportunities in other sectors like AAA-rated agency mortgage-backed securities (MBS), preferred securities, and high-quality municipal securities. As the government navigates this refinancing cycle, maintaining a diversified approach to fixed income investing, with careful attention to duration and credit quality, becomes increasingly important.
Impending Maturity Wall
$7.5 Trillion in Coupon Securities Mature over the Next Three Years
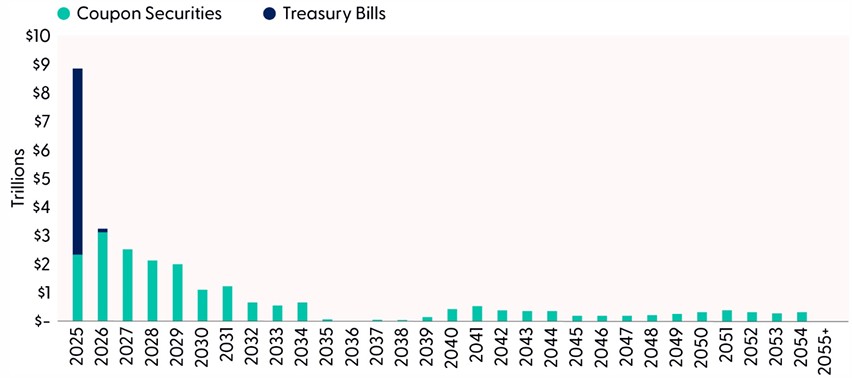
Source: LPL Research, Bloomberg, 02/19/25
The Debt Ceiling: Here We Go Again
In other news, while the refinancing situation is a potential concern over the next few years, the ongoing debt ceiling debate is starting to creep into market pricing. The Treasury market is already showing signs of stress around a potential July/August debt ceiling showdown. As the chart indicates, T-bill yields are elevated for securities maturing around this period, with investors demanding higher yields to compensate for potential payment delay risks. This market behavior is a familiar warning sign, reminiscent of previous debt ceiling confrontations.
Since 1960, Congress has acted 78 times to raise, extend, or revise the debt ceiling — 49 times under Republican presidents and 29 times under Democratic presidents. Despite this long history of eventual resolution, each confrontation creates unnecessary market turbulence and costs to taxpayers. The 2011 standoff, which led to the U.S. losing its AAA credit rating from S&P, and the 2023 episode (Fitch downgrade) both demonstrated how these political battles can rattle financial markets and increase government borrowing costs even after resolution.
The current market pricing suggests investors are treating late July/early August as the potential “X-date” — the point at which the Treasury would exhaust its extraordinary measures without congressional action. Bills maturing during this period are yielding around 4.35–4.38%, notably higher than surrounding maturities, indicating a risk premium of several basis points. This “kink” in the T-bill curve might seem small, but in the nearly $7 trillion T-bill market, it represents significant concern about another partisan standoff. Given the current political climate and narrow House majority, markets appear to be bracing for another round of brinksmanship, even though history suggests Congress will ultimately act to prevent a default.
U.S. bond market investors have endured a lot lately, so the last thing they want to see is the government hold hostage the full faith and credit of the government’s willingness and ability to pay its debts. While its ability to repay its obligations is not in question, the debt ceiling debate complicates the country’s willingness to pay its debts. While we think Congress will act in time and either raise, suspend, or even eliminate the debt ceiling, these games of political chicken can introduce volatility to markets in the meantime.
Markets Are Pricing in a July/August X-Date
T-Bill Yields Have Started to Price in Delayed Payment Risk
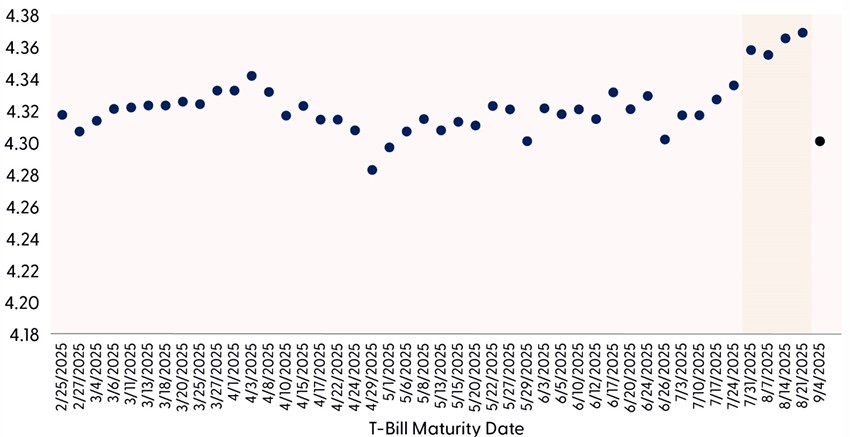
Source: LPL Research, Bloomberg, 02/19/25
Conclusion
The Treasury market is adapting to several concurrent developments — a major refinancing cycle, the normalization of interest rates following the ZIRP era, and ongoing debt ceiling discussions. Congress has successfully addressed the debt ceiling 78 times since 1960, demonstrating a consistent ability to find a resolution despite political debate. While the refinancing of $7.5 trillion in debt at higher rates will increase annual interest costs by $94 to $131.5 billion, this represents a natural consequence of monetary policy normalization rather than a crisis. The market’s resilience through past transitions suggests it will adapt to these evolving conditions, even as investors adjust to a new interest rate environment. These changes will require ongoing attention from policymakers and market participants alike, but they represent manageable challenges within our established fiscal and monetary frameworks.
Asset Allocation Insights
LPL’s Strategic and Tactical Asset Allocation Committee (STAAC) maintains its tactical neutral stance on equities, with a preference for the U.S., a slight tilt toward growth, and benchmark-like exposure across the market capitalization spectrum. However, we do not rule out the possibility of short-term weakness as sentiment remains stretched and a lot of good news is priced into markets, even as geopolitical threats escalate. Within fixed income, the STAAC continues to hold an overweight tilt in preferred securities as valuations remain attractive. However, the risk/reward for core bond sectors (U.S. Treasury, agency MBS, investment-grade corporates) is more attractive than plus sectors, which generally include high-yield, emerging market, and global bonds. In our view, adding duration isn’t attractive at current levels, and the STAAC remains neutral relative to our benchmarks.
Important Disclosures
This material is for general information only and is not intended to provide specific advice or recommendations for any individual. There is no assurance that the views or strategies discussed are suitable for all investors or will yield positive outcomes. Investing involves risks including possible loss of principal. Any economic forecasts set forth may not develop as predicted and are subject to change.
References to markets, asset classes, and sectors are generally regarding the corresponding market index. Indexes are unmanaged statistical composites and cannot be invested into directly. Index performance is not indicative of the performance of any investment and do not reflect fees, expenses, or sales charges. All performance referenced is historical and is no guarantee of future results.
Any company names noted herein are for educational purposes only and not an indication of trading intent or a solicitation of their products or services. LPL Financial doesn’t provide research on individual equities.
All information is believed to be from reliable sources; however, LPL Financial makes no representation as to its completeness or accuracy.
All investing involves risk, including possible loss of principal.
US Treasuries may be considered “safe haven” investments but do carry some degree of risk including interest rate, credit, and market risk. Bonds are subject to market and interest rate risk if sold prior to maturity. Bond values will decline as interest rates rise and bonds are subject to availability and change in price.
The Standard & Poor’s 500 Index (S&P500) is a capitalization-weighted index of 500 stocks designed to measure performance of the broad domestic economy through changes in the aggregate market value of 500 stocks representing all major industries.
The PE ratio (price-to-earnings ratio) is a measure of the price paid for a share relative to the annual net income or profit earned by the firm per share. It is a financial ratio used for valuation: a higher PE ratio means that investors are paying more for each unit of net income, so the stock is more expensive compared to one with lower PE ratio.
Earnings per share (EPS) is the portion of a company’s profit allocated to each outstanding share of common stock. EPS serves as an indicator of a company’s profitability. Earnings per share is generally considered to be the single most important variable in determining a share’s price. It is also a major component used to calculate the price-to-earnings valuation ratio.
All index data from FactSet or Bloomberg.
This research material has been prepared by LPL Financial LLC.
Securities and advisory services offered through LPL Financial (LPL), a registered investment advisor and broker dealer, member FINRA/SIPC. To the extent you are receiving investment advice from a separately registered independent investment advisor that is not an LPL affiliate, please note LPL makes no representation with respect to such entity. If your advisor is located at a bank or credit union, please note that the bank/credit union is not registered as a broker-dealer or investment advisor. Registered representatives of LPL may also be employees of the bank/credit union. These products and services are being offered through LPL or its affiliates, which are separate entities from, and not affiliates of, the bank/credit union.
Not Insured by FDIC/NCUA or Any Other Government Agency | Not Bank/Credit Union Guaranteed | Not Bank/Credit Union Deposits or Obligations | May Lose Value
For public use.
Member FINRA/SIPC.
RES-0002850-0125 Tracking #699563 (Exp. 02/26)