Last week was one for the ages in terms of the number and magnitude of events and data points for investors to digest. A Federal Reserve (Fed) meeting, the monthly jobs report, and the peak week of earnings season would be enough to qualify as a busy week. But add in the U.S.-China negotiations, the August 1 tariff deadline, the U.S. Treasury Department quarterly refunding announcement, and the Fed’s preferred inflation metric, and last week gave investors as much to digest as any week in recent memory. Here we share seven takeaways for investors based on last week’s plethora of news.
Takeaway #1: Stage is Set for September Rate Cut from the Federal Reserve
For the first time since 1993, two members of the Federal Open Market Committee (FOMC) dissented from the majority. Now, for full disclosure, a single dissent has been more common over the years. Not surprisingly, committee members Michelle Bowman and Christopher Waller wanted to cut rates by a quarter point, but the majority prevailed as the Committee made no changes to the federal funds target rate. The Committee did pivot to a slightly more dovish position, with the view expressed in the Fed’s accompanying statement that economic conditions “moderated in the first half of the year.” This paves the way for a cut at the next meeting in September, even though the message from the press conference was more nuanced. Fed Chair Jerome Powell mixed in some hawkish statements, which pushed the probability of a September cut to 40%, down from 58% a week prior. However, expectations changed dramatically following the release of the latest jobs report, illustrating the day-to day volatility of market rate expectations. LPL Research still believes the rate-setting committee has set the stage to act at the next meeting on September 17, supported by additional signs of softening economic conditions, including the soft July jobs report (more on that below).
Fed Press Conference Slightly Dampened Rate Cut Expectations for 2025
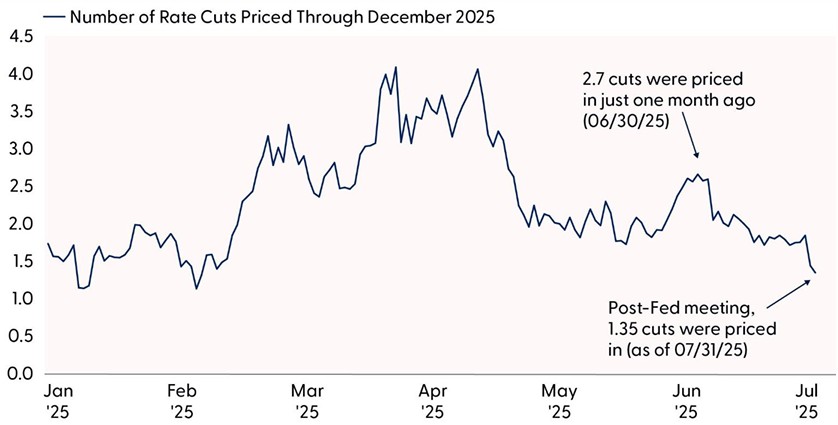
Data series measures the number of 0.25% rate cuts implied by federal funds futures market pricing.
Source: LPL Research, Bloomberg, 07/31/25
Disclosures: All indexes are unmanaged and cannot be invested in directly. Past performance is no guarantee of future results. Estimates may not materialize as predicted.
Takeaway #2: The U.S. Economy Is Clearly Slowing
The economy temporarily rebounded in the second quarter as businesses imported less in the second quarter than they did in the first. But this should not be construed as an improvement in underlying economic momentum.
The 3% increase in real gross domestic product (GDP) in the second quarter primarily reflected a drop in imports, which is a subtraction in the GDP calculation. Real final sales to private domestic purchasers, the sum of consumer spending and gross private fixed investment increased 1.2% in the second quarter, compared with an increase of 1.9% in the first quarter. We are also starting to see the effects of trade policy. The drop in imports was led by nondurable consumer goods, mainly medicinal, dental, and pharmaceutical items.
Investors should focus on the deceleration in consumer spending. Now that delinquencies are starting to rise for upper-income consumers, we expect consumer spending to moderate further in the coming quarters. The soft July jobs report included significant downward revisions to previous months’ estimates so on net, employment in May and June combined was 258,000 lower than previously reported. Following Friday’s payroll numbers, the three month average gain in jobs is just 35,000. Are there any encouraging signs? Just a few. The unemployment rate has remained in a narrow range of 4.0–4.2% since May 2024, offering some sense of stability amid the uncertainty. And average hourly earnings have increased by 3.9% from a year ago, outpacing the rate of inflation and giving consumers some ability to spend.
Slowing consumer spending should also help to alleviate inflation pressures (further supporting Fed rate cuts). The improvement in inflation is stalling, as evidenced by last week’s personal consumption expenditures index (PCE) price index data — core PCE rose 2.8% year over year for two straight months — but is expected to resume its descent toward the Fed’s 2% target over the next several months.
Track Consumer Spending as Trade Policy Shocks Impacted Growth Metrics
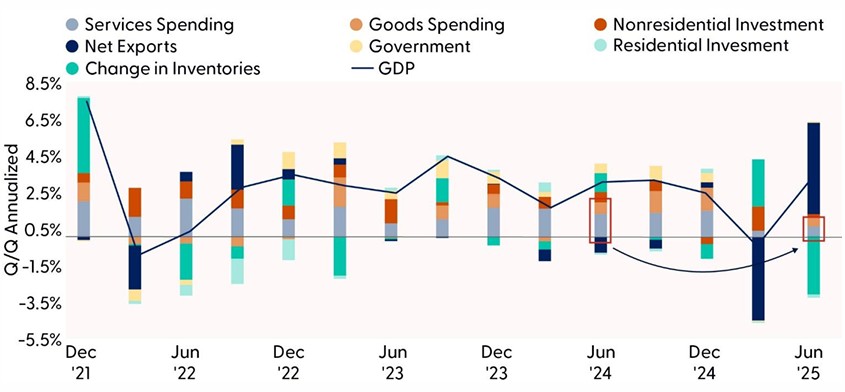
Source: LPL Research, U.S. Bureau of Economic Analysis, 07/30/25
Takeaway #3: The S&P 500 Has More Earnings Power Than We Thought
When earnings season began, the consensus S&P 500 earnings per share (EPS) estimate called for a 4–5% year-over year increase. We had expected some upside, potentially to 7–8%, as tariffs began to weigh on profit margins. Well, with about two-thirds of S&P 500 companies having reported results, the index is tracking to a more than 10% increase in earnings (source: FactSet).
It won’t surprise anyone to learn that big tech is the key driver after significant earnings growth from the Magnificent (Mag) Seven. In fact, based on actual results for those big tech companies that have reported and estimates for the one that hasn’t, NVIDIA (NVDA), the Mag Seven is expected to contribute five percentage points of growth to the S&P 500 and grow EPS by an average of 27%, excluding the EPS decline from Tesla (TSLA). From the perspective of the S&P sector classifications, eight of the nine points of S&P 500 EPS growth is coming from communication services and technology.
Estimates for 2026 have reflected this impressive earnings power. Estimates typically fall by a couple percent or so during earnings seasons, but estimates have risen during this earnings season. LPL Research based its 2026 S&P 500 year-end fair-value target on $275 in S&P 500 EPS next year, which corporate America is telling us is probably too low.
Sign of a Solid Earnings Season: Higher Out-Year Estimates
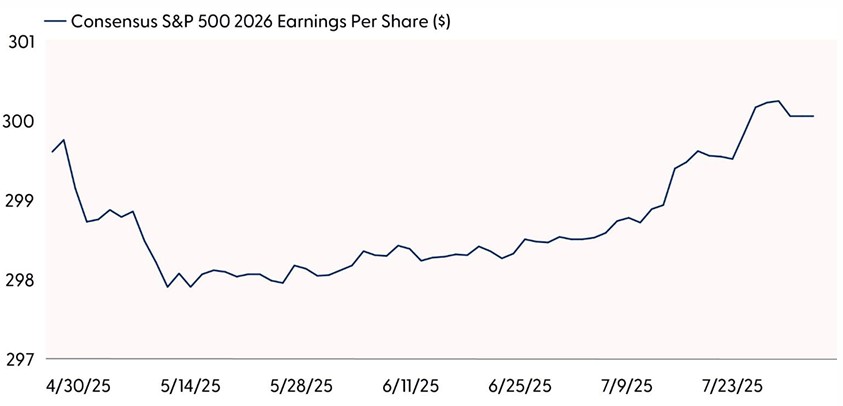
Source: LPL Research, FactSet, 07/31/25
Disclosures: All indexes are unmanaged and cannot be invested in directly. Past performance is no guarantee of future results. Estimates may not materialize as predicted and are subject to change
Takeaway #4: The Artificial Intelligence Dream is Alive
Arguably the most impressive news of the week was the strong growth and capital expenditures (capex) guidance from Meta (META) and Microsoft (MSFT), which reported quarterly results on Wednesday, July 30.
While the high end of Meta’s 2025 capex was unchanged ($72 billion), the company indicated that it is likely to invest around $100 billion in 2026 as it pursues its vision to bring superintelligence to everyone. Meta is an example of artificial intelligence (AI) bearing fruit given the solid results in digital advertising.
Microsoft’s Azure cloud business unexpectedly experienced accelerating growth, to 39% year over year from 35% the prior quarter and consensus estimates at 34%, in part due to the AI tailwind. The company noted that data center demand outstripped supply, reported solid growth in its copilot AI tool, and guided to $30 billion in capex for just the current quarter.
Last week, Amazon (AMZN) also noted a ramp up in capex, with $31 billion in the second quarter and $120 billion expected for the full year, above prior expectations and driven mostly by AI.
In addition, the previous week, Alphabet (GOOG/L) raised its capex guidance for 2025 from $75 billion to $85 billion and expects higher capex in 2026.
Not only is the big AI investment getting bigger — potentially north of $375 billion in 2025 from the Mag Seven and even more in 2026 — we are also starting to hear about payoffs from the investments. The earnings tailwind from the investment is strong right now and will remain so in 2026, by which time we expect meaningful productivity gains to have started to kick in. Overinvestment is a risk, but we consider these investments “innocent until proven guilty” for now.
Takeaway #5: Trade and Tariff Risk Lingers
The Trump administration provided investors a reminder on the trade negotiating deadline, August 1, that tariff risk cannot be totally dismissed. Several countries that failed to reach a trade agreement or carry transshipment risk have been assigned higher tariff rates than the original base 10% reciprocal rate and the apparent new baseline rate of 15%.
Most of these countries are second or third-tier trading partners, but India, at a rate of 25%, Switzerland at 39%, and several Southeast Asian nations at 19% or 20% (e.g., Indonesia, Malaysia, Taiwan, Thailand) will — it appears — lift the overall U.S. weighted average tariff rate to over 15%. Some Canadian goods not covered by the United States Mexico-Canada Agreement (USMCA) will face tariff rates of 35%. Some Brazilian goods will face a rate of 50%. Meanwhile, sectoral tariffs are yet to come and may push that rate up another point or two higher.
The good news, besides the needed revenue tariffs bring for the U.S. Treasury, this rate is about half the threatened rate from April 2. And fiscal stimulus coming in a big way in 2026 from the so-called One Big Beautiful Bill Act (OBBBA) will help offset the drag. The challenge is that only about half of these higher tariffs have kicked in so far (roughly 8% out of the 15%), meaning that another seven points are yet to be absorbed by the economy and corporate America (the rates announced as of August 1 will go into effect on August 7).
Bottom line, while the effects of tariffs on inflation are mostly temporary, some upward pressure on prices and a drag on profit margins is yet to be felt and will likely present this market’s biggest test over the seasonally weak period for stocks over August and September.
Takeaway #6: Treasury Will Continue to Rely on T-Bill Issuance
It’s not too often that a Fed meeting isn’t the most important event for the bond market, but that was the case last week. In fact, you could argue that the Fed meeting was the third most important event of the week, with Friday’s jobs report and the Treasury Department’s quarterly refunding announcements (QRA) sharing top billing.
Friday’s employment data provided the catalyst that bond markets had been waiting for, finally pushing Treasury yields out of their recent trading ranges. The decidedly weak jobs report, combined with downward revisions to previous months’ data, sent Treasury yields lower across the entire yield curve. Markets responded by pricing in more aggressive Fed rate cuts, reflecting growing concerns about economic momentum. While the jobs report captured immediate market attention, the Treasury Department’s QRA may have more lasting implications for debt markets — not from what was said, per se, but from what the Treasury Department refuses to do.
The Treasury delivered several key decisions that will shape government debt management going forward. Most notably, Treasury plans to keep coupon auction sizes unchanged throughout the August quarter, reinforcing the long-held market view that coupon issuance will remain stable and Treasury Bill (T-bill) issuance will increase. Treasury officials indicated that coupon sizes are expected to remain steady until at least February 2027, stating they anticipate no increases for “at least the next several quarters.” This predictable approach aligns with Treasury’s goal of maintaining consistent and orderly debt issuance patterns.
The department also announced enhancements to its buyback operations, with mechanics that differed somewhat from market expectations. The frequency of long-end buybacks will double, and total liquidity support buybacks will increase to $38 billion per quarter. Additionally, cash management buybacks will rise to $150 billion per quarter, though these operations will pause around the September corporate tax date and resume in December, all of which will likely reduce the weighted-average maturity of outstanding Treasury debt.
These Treasury decisions reflect broader structural challenges facing government financing. The government’s persistent budget deficits of $1.5–2.0 trillion annually require continuous Treasury issuance to bridge the gap between spending and revenue. With supply and demand imbalances creating challenges for longer-maturity securities, the government is likely to continue to rely on T-bill issuance rather than coupon securities to meet financing needs.
Currently, T-bill issuance is above 20% of all Treasury debt issuance, which is higher than the recommendation from the Treasury Borrowing Advisory Committee (TBAC) and is seemingly poised to go higher. Treasury’s reluctance to term out its debt and its continued reliance on shorter-term debt create potential rollover risks, as nearly $6 trillion of the $29 trillion in marketable debt is already in bills. While current money market fund assets provide adequate demand, future rate cuts could trigger an exodus from cash instruments just as bill issuance requirements peak, creating a concerning dynamic for Treasury financing operations.
Treasury Bill Issuance May Start Rising Again
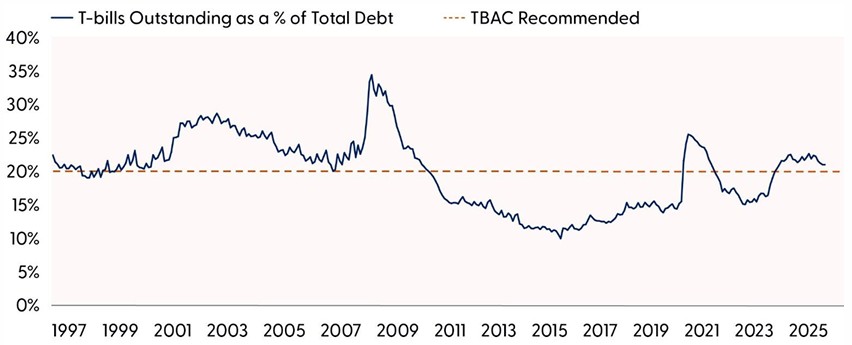
Source: LPL Research, Bloomberg, 07/31/25
Disclosures: All indexes are unmanaged and cannot be invested in directly. Past performance is no guarantee of future results. Estimates may not materialize as predicted and are subject to change.
Takeaway #7: Technical Analysis Suggests the S&P 500 May Be Due for a Pullback
Volatility came back on cue last week as the S&P 500 fell close to 2% on Friday, ending a 32-trading-day streak without a 1% decline. Selling pressure was widespread and dragged the index back below its 20-day moving average (dma), an area that has been a consistent area of dynamic support over the last few months. This leaves the 6,200 area as the next area of support for the broader market, followed by February highs at 6,144. Breadth measures are holding up relatively well, with over 50% of S&P 500 stocks holding up above their 200-dma on Friday, while the majority of index constituents remain in uptrends.
Outside of overbought conditions last month and trade uncertainty, seasonal trends suggest volatility could heat up in August. Since 1950, the S&P 500 has traded near the flatline on average. However, when the index is lower on the month, the average loss has been -3.8%, compared to the average gain of 3.2%. The CBOE Volatility Index, or more commonly referred to as the VIX or “fear-gauge,” also tends to advance in August. Since 1990, the VIX has posted an average gain of 8.4%, with 57% of months finishing positive (tied with October as the highest positivity rate across the calendar).
Overall, we view the recent weakness that capped off last week as a potential starting point for some short-term pain ahead of longer-term gains. Wait for evidence of support holding up and short-term momentum turning more positive before buying the dip.
S&P 500 is Overbought and Likely Due for a Pullback
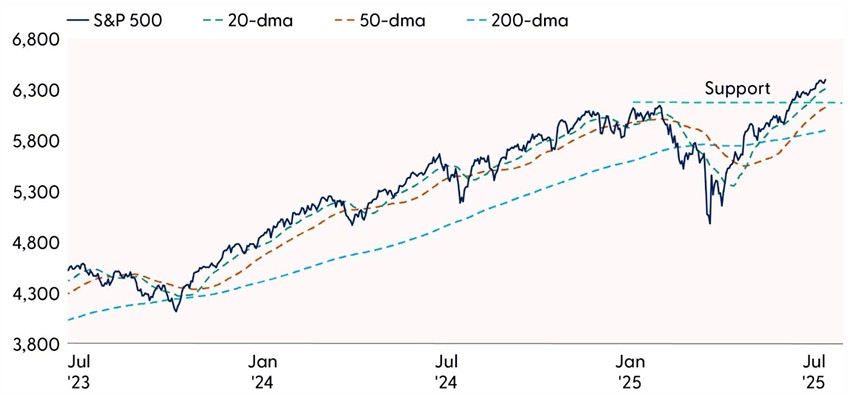
Source: LPL Research, Bloomberg, 07/31/25
Disclosures: Past performance is no guarantee of future results. Indexes are unmanaged and cannot be invested in directly. Estimates may not materialize as predicted and are subject to change.
Conclusion
After a dizzying week, the dog days of August arrived with a thud as stocks sold off on the weak jobs report, some unexpected tariff increases, and mixed earnings reports. Some of Friday’s weakness also reflected overbought conditions and a stock market that was due for a breather. As the seasonally weak period of August and September arrives, it’s a convenient time for a pullback. As the economy slows and more tariffs are implemented, more bouts of volatility are likely. But given the powerful AI trend, the significant earnings power of big tech, forthcoming Fed rate cuts, and the fiscal stimulus boost when 2026 begins, we would expect pullbacks to be shallow and bought.
Asset Allocation Insights
LPL’s Strategic and Tactical Asset Allocation Committee (STAAC) maintains its tactical neutral stance on equities. Investors may be well served by bracing for occasional bouts of volatility given how much optimism is currently reflected in stock prices. LPL Research advises against increasing portfolio risk beyond benchmark targets currently and continues to monitor tariff negotiations, economic data, earnings, the bond market, and various technical indicators to identify a potentially more attractive entry point to add equities on weakness. The Committee’s regional preferences across the U.S, developed international, and emerging markets (EM) are aligned with benchmarks. The Committee still favors growth over value, large caps over small caps, and the communication services and financials sectors.
Within fixed income, the STAAC holds a neutral weight in core bonds, with a slight preference for mortgage-backed securities (MBS) over investment-grade corporates. The Committee believes the risk-reward for core bond sectors (U.S. Treasury, agency MBS, investment-grade corporates) is more attractive than plus sectors. The Committee does not believe adding duration (interest rate sensitivity) at current levels is attractive and remains neutral relative to benchmarks. The Committee would get more interested in adding long-term bonds if the U.S. 10-Year Treasury yield got closer to 5%.
Important Disclosures
This material is for general information only and is not intended to provide specific advice or recommendations for any individual. There is no assurance that the views or strategies discussed are suitable for all investors or will yield positive outcomes. Investing involves risks including possible loss of principal. Any economic forecasts set forth may not develop as predicted and are subject to change.
References to markets, asset classes, and sectors are generally regarding the corresponding market index. Indexes are unmanaged statistical composites and cannot be invested into directly. Index performance is not indicative of the performance of any investment and do not reflect fees, expenses, or sales charges. All performance referenced is historical and is no guarantee of future results.
Any company names noted herein are for educational purposes only and not an indication of trading intent or a solicitation of their products or services. LPL Financial doesn’t provide research on individual equities.
All information is believed to be from reliable sources; however, LPL Financial makes no representation as to its completeness or accuracy.
All investing involves risk, including possible loss of principal.
US Treasuries may be considered “safe haven” investments but do carry some degree of risk including interest rate, credit, and market risk. Bonds are subject to market and interest rate risk if sold prior to maturity. Bond values will decline as interest rates rise and bonds are subject to availability and change in price.
The Standard & Poor’s 500 Index (S&P500) is a capitalization-weighted index of 500 stocks designed to measure performance of the broad domestic economy through changes in the aggregate market value of 500 stocks representing all major industries.
The PE ratio (price-to-earnings ratio) is a measure of the price paid for a share relative to the annual net income or profit earned by the firm per share. It is a financial ratio used for valuation: a higher PE ratio means that investors are paying more for each unit of net income, so the stock is more expensive compared to one with lower PE ratio.
Earnings per share (EPS) is the portion of a company’s profit allocated to each outstanding share of common stock. EPS serves as an indicator of a company’s profitability. Earnings per share is generally considered to be the single most important variable in determining a share’s price. It is also a major component used to calculate the price-to-earnings valuation ratio.
All index data from FactSet or Bloomberg.
This research material has been prepared by LPL Financial LLC.
Not Insured by FDIC/NCUA or Any Other Government Agency | Not Bank/Credit Union Guaranteed | Not Bank/Credit Union Deposits or Obligations | May Lose Value
For public use.
Member FINRA/SIPC.
RES-0005028-0725 Tracking #777647 | #778282 (Exp. 08/26)